
Background and Context
A fall in the number of polluted river stretches in a state is useful information, but it does not lead to the conclusion that the water of every river has become better. Along with the total number, the severity of pollution, the places of monitoring and the parameters tested have to be seen. The parliamentary answer of July 2026 about Karnataka teaches this difference: the total number of river stretches recorded fell between 2018 and 2025, but the 2025 table also has three stretches of the most severe priority class.
Why in the News
In Unstarred Question 21 of 20 July 2026, the Ministry of Environment, Forest and Climate Change gave the 358 water quality monitoring locations in Karnataka and the priority-wise number of polluted river stretches. According to the answer, CPCB identified 17 polluted stretches in 17 rivers in 2018 and 14 stretches in 14 rivers in 2025. The table does not give river names, the length of stretches, or the year-to-year concentrations at the same locations.
What Does BOD Tell, and What Does It Not?
The answer describes Biochemical Oxygen Demand (BOD) as a measure of the organic pollution load. The priority of river stretches has been decided on its level. A class with higher BOD points to severe organic pollution, but BOD alone cannot decide all the chemical and microbial risks of the water or its fitness for drinking.
Key Facts and Figures
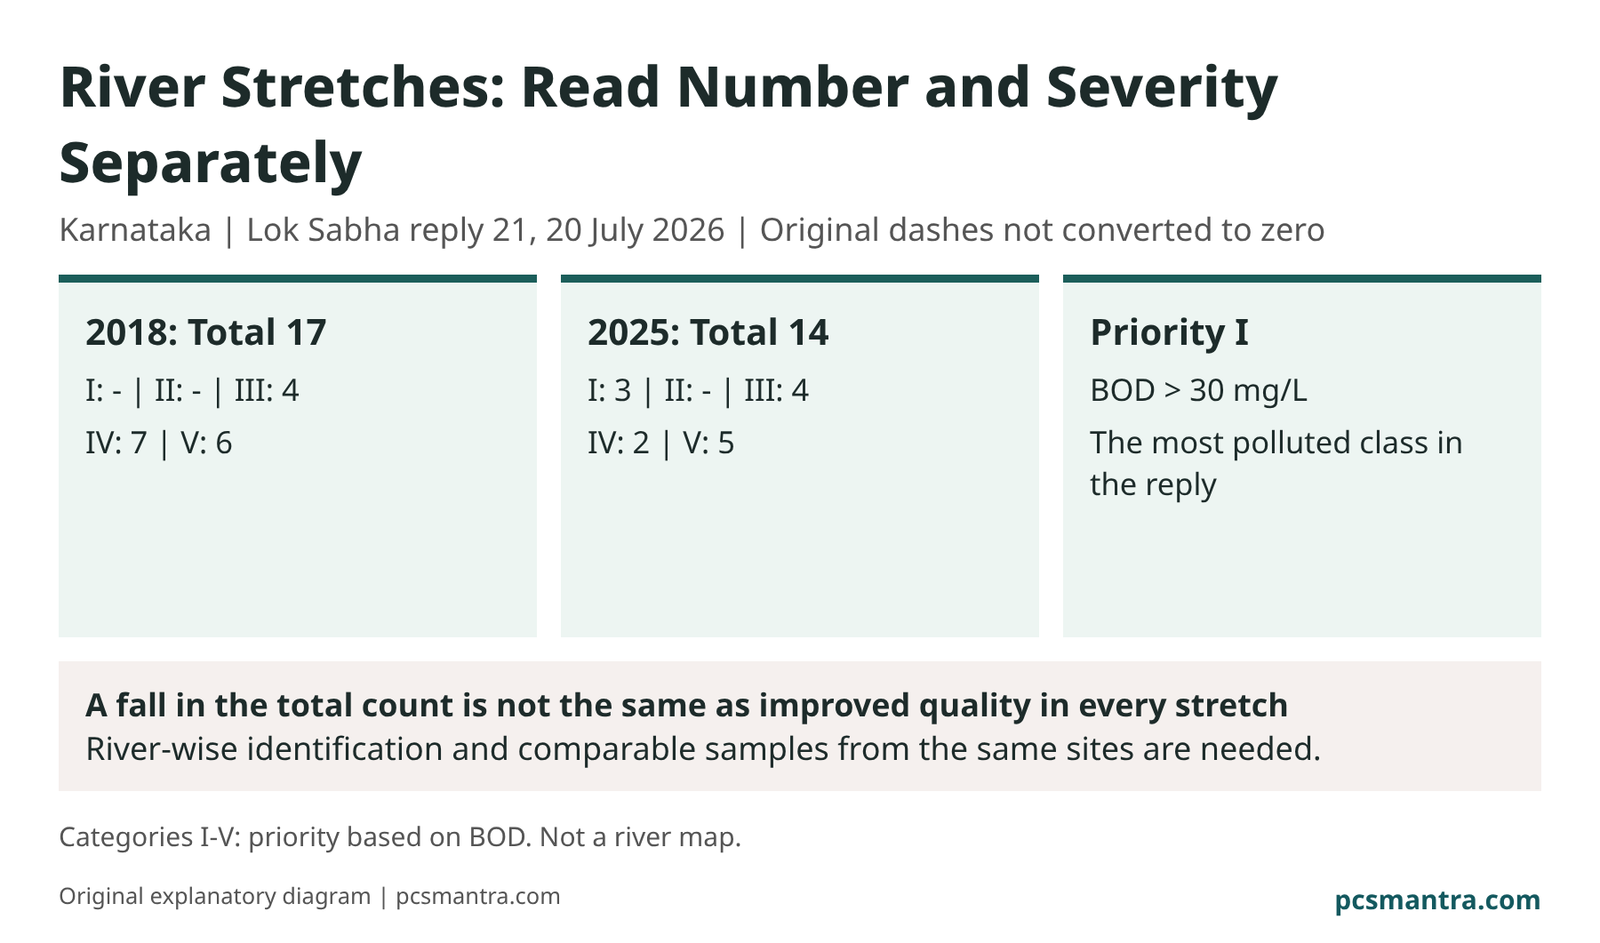
| 2018: Priority I to V | Table: I -, II -, III 4, IV 7, V 6; total 17. The dashes are of the original table. Our check: the numerical cells given 4 + 7 + 6 = 17. |
|---|---|
| 2025: Priority I to V | I 3, II -, III 4, IV 2, V 5; total 14. Our check: 3 + 4 + 2 + 5 = 14. The answer has no data to link these three Category-I stretches to any particular stretch of 2018. |
| Priority based on BOD | Table of the answer (mg/L): I >30; II 20.1-30.0; III 10.1-20.0; IV 6.1-10.0; V 3.1-6.0. In the description above, V is also written as 3-6; here the limit of the table is kept. |
| 358 monitoring locations | River/dam 126; lakes 151; pond 1; tanks 67; coastal/marine etc. 5; groundwater 2; reservoir 6. Our calculation: the sum of these seven cells matches 358. These are a count of locations, not of polluted locations. |
From Monitoring to River Rejuvenation
Identification and priority: The answer says polluted stretches are identified on the basis of the bathing-water BOD criterion exceeding 3 mg/L. Priority-I is called the most polluted class. This is a limited classification, not a single number for the health of the whole river system.
Bathing and drinking water are separate: The bathing-water criteria available on CPCB also have dissolved oxygen, pH and faecal bacterial indicators besides BOD. So being within the BOD limit alone is not proof of complete bathing safety; and being fit for bathing does not directly give proof of being fit for drinking.
Chain of responsibility: The River Rejuvenation Committees of state governments made action plans to bring the identified stretches to bathing-quality. According to the answer, at the state level these committees and at the Centre the Central Monitoring Committee chaired by the Secretary, Jal Shakti review progress.
How to Draw the Right Meaning of a Lower Number?
Severity along with the count: Our analysis: do not make the fall of the total from 17 to 14 alone the final test of achievement. Having 3 Priority-I stretches in 2025 shows that the total count and class distribution answer different questions. It does not give a certain story of three stretches newly arising or old stretches worsening.
The choice of location matters: The NWMP page of CPCB says most locations are impact locations that test the effect of possible pollution sources. They should not be taken as a random sample of all water sources of the state. It would also be unfair to describe the quality of the state's whole groundwater from the 2 groundwater locations among the 358.
What Is Not Known Yet?
Incomplete basis of comparison: The answer does not say which stretches were common in 2018 and 2025, whether the sampling frequency and locations were the same, and which stretch changed which class. So no estimate has been made of river-wise improvement, the cause of cleaning or health benefit.
Sanction is not result: In the answer, for Karnataka, 159 lake rejuvenation projects of AMRUT 2.0 with Rs 520.20 crore and 5,884.85 acres of area are stated to be sanctioned. These are a different unit from river stretches; they do not confirm the treatment of the 14 stretches or completion of work.
Limit of reading: The parliamentary answer was read in full, but this article is on its water-quality part. CPCB's year-wise raw measurement tables, separate state action plans and project completion reports were not read. No advice is being given on the river condition after July or on safe use of water.
Way Forward
Our policy suggestion is to publish a comparable record that shows the identification of the stretch, the monitoring location, the season and the pollutant level together. In the action plan, the pollution source, responsible body, time limit and the check of later water samples should be recorded separately. Success should be assessed going beyond the number of projects, on the full test of the quality of the same stretch and its intended use.
Conceptual Difference
Monitoring location is not a polluted river stretch is not a rejuvenation project. A lower number of stretches is not lower severity in all stretches. BOD-based priority is not the complete safety of water.
Mains Perspective
GS-III: water pollution and conservation; GS-II: environmental governance and accountability. Make clear the relation between data, classification and policy outcome.
UPSC CSE Mains Style: Original Practice Question
Why can a decrease in the number of polluted river stretches not be taken as sufficient proof of river rejuvenation? Explain in the context of the structure of monitoring, severity of pollution and governance accountability.
(Answer in 150 words) | 10 marks
Answer Outline
Introduction: 17 to 14 stretches in Karnataka; total and priority distribution.
Main Body: BOD and multi-parameter water quality; the limit of impact locations; comparable measurements of the same stretches; action plan, responsibility and result check.
Conclusion: Judge quality from comparable locations, weather and pollutant levels of the same river stretch; the responsibility for the action plan and later sample testing should be clear, because a falling stretch count alone is not proof of rejuvenation.
Sources
- Lok Sabha Unstarred Question 21, answer 20.07.2026; water quality details pages 1-3
- CPCB: NWMP Data; update date on the page 18.06.2026, clarification on the choice of monitoring locations
- Gazette notification of 25.09.2000 available on CPCB: Primary Water Quality Criteria for Bathing Waters
All five pages of the parliamentary answer were read; the air quality part is not the subject of this article. The relevant original text of CPCB's NWMP page and the bathing-water criteria was read. River-wise trends, raw samples and independent impact evaluation were not checked.
Remember: Along with the count of polluted stretches, read the severity and the basis of monitoring; do not take a lower count automatically as clean and safe water.
Download This Article: PDF